


Introduction
When measuring website performance, looking at a single day’s traffic rarely tells the complete story.
A website can experience a sudden increase in visitors because of a social media post, a news event, a new backlink, a seasonal trend, or a particular search query. Similarly, traffic can temporarily fall because of weekends, holidays, technical problems, or changes in search demand.
This is why choosing the right reporting period matters.
One particularly useful reporting period for website analysis is the 28-day window.
A 28-day period represents four complete weeks. That makes it useful for comparing website performance while reducing the effect of normal weekly fluctuations.
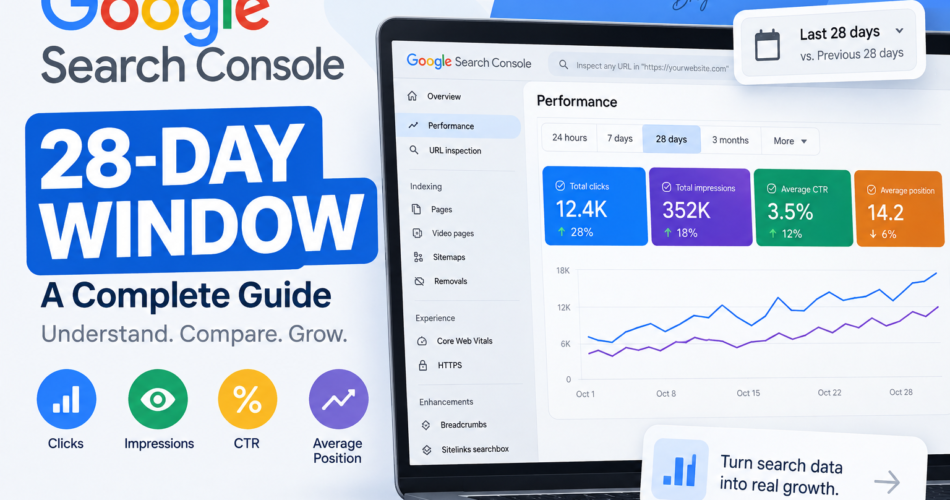
Google Search Console allows website owners to select different date ranges and compare periods. Its Performance report provides data such as clicks, impressions, click-through rate (CTR), and average position, while its comparison functionality can be used to compare different time periods.
However, there is an important clarification:
The 28-day window should not be confused with a rule that Google takes 28 days to rank a website.
It is a reporting and analysis period, not a fixed Google ranking cycle.
What Is a 28-Day Reporting Window?
A 28-day reporting window is a period containing exactly four weeks of website performance data.
For example:
Current 28 Days
August 10 → September 6

Previous 28 Days
July 13 → August 9
The two periods can then be compared.
Instead of asking:
“How many clicks did my website receive yesterday?”
you can ask:
“How did my website perform during the most recent four weeks compared with the previous four weeks?”
That second question usually provides more useful information for SEO decision-making.
Why 28 Days?
The biggest advantage of 28 days is that it contains exactly four weekly cycles.
Website traffic often follows weekly patterns.
For example:
| Day | Example Traffic |
|---|---|
| Monday | 150 |
| Tuesday | 170 |
| Wednesday | 165 |
| Thursday | 180 |
| Friday | 190 |
| Saturday | 85 |
| Sunday | 70 |
If you compare only seven random days with another seven days, the result can be heavily influenced by which weekdays are included.
A 28-day period gives you four Mondays, four Tuesdays, four Wednesdays, and so on.
This makes it easier to identify an actual trend rather than reacting to normal day-to-day variation.
Google also recommends considering weekly or monthly granularity when comparing periods because aggregating data can reduce the impact of day-of-week differences.
Is 28 Days the Default in Google Search Console?
This is an important distinction.
The current Google Search Console Performance report documentation states that its default view shows data for the past three months. Users can change the date range and select different reporting periods.
Therefore:
28 days is not the same thing as saying “Google Search Console always reports only the last 28 days.”
Instead, 28 days is a useful period that you can select when you want to analyze recent performance or build a consistent reporting framework.
Google Search Console also provides comparison functionality for different periods, including comparisons such as the last week versus the previous week and other custom date ranges.
What Can You Measure During 28 Days?
A 28-day SEO report can contain several important metrics.
1. Clicks
Clicks represent visits to your website from Google Search results.
For example:
Previous 28 Days: 1,250 clicks
Current 28 Days:  1,540 clicks
The website gained:
1,540 - 1,250 = 290 additional clicks
Percentage growth:
(290 / 1,250) × 100 = 23.2%
So the website’s Google Search clicks increased by approximately 23.2%.
2. Impressions
Impressions indicate how frequently pages from your website appeared in Google Search results.
Imagine:
Previous 28 Days: 42,000 impressions
Current 28 Days:  53,000 impressions
That represents an increase of:
11,000 impressions
or approximately:
26.2%
An increase in impressions can indicate that your pages are appearing for more searches, appearing more frequently, or becoming visible for a broader range of queries.
3. Click-Through Rate
Click-through rate, or CTR, helps answer another important question:
When people see your page in Google Search, how frequently do they click it?
The basic formula is:
CTR = (Clicks ÷ Impressions) × 100
For example:
1,500 clicks
50,000 impressions

CTR = (1,500 ÷ 50,000) × 100
    = 3%
CTR should generally be analyzed together with impressions and position rather than treated as an isolated number.
4. Average Position
Search Console also provides average position.
This metric can help you understand how your pages are performing in Google Search.
For example:
Previous 28 Days: 12.4
Current 28 Days:   9.8
A lower average-position number generally indicates improvement.
However, average position is an aggregate metric and should not be interpreted as saying that every query ranks at that exact position.
Google explains that Search results are personalized based on factors such as time, location, device, and search history, so manually searching for a query and comparing the result with Search Console should not be treated as an exact ranking measurement.
The Power of “Current 28 Days vs Previous 28 Days”
One of the most useful ways to use the 28-day window is period-over-period comparison.
Consider this example:
| Metric | Previous 28 Days | Current 28 Days | Change |
|---|---|---|---|
| Clicks | 1,250 | 1,540 | +23.2% |
| Impressions | 42,000 | 53,000 | +26.2% |
| CTR | 2.98% | 2.91% | -0.07 pp |
| Average Position | 12.4 | 9.8 | Improved |
This immediately provides a story about the website.
The website:
- received more Google Search clicks;
- received more impressions;
- improved its average position;
- but experienced a slight reduction in CTR.
That is much more informative than simply saying:
“The website received 1,540 clicks.”
A Simple 28-Day SEO Dashboard
A website report based on the 28-day period could start with a summary section.
┌──────────────────────────────────────────────────────────┐
│                 WEBSITE PERFORMANCE                      │
│                  LAST 28 DAYS                            │
├──────────────────────────────────────────────────────────┤
│                                                          │
│   CLICKS       IMPRESSIONS       CTR       AVG POSITION │
│   1,540          53,000          2.91%          9.8     │
│                                                          │
│   ↑ 23.2%       ↑ 26.2%          ↓ 0.07pp       ↑       │
│                                                          │
└──────────────────────────────────────────────────────────┘
Below the summary cards, you could include:
Traffic Trend
A 28-day line chart showing daily clicks or impressions.
Top Pages
A table showing:
- Page
- Clicks
- Impressions
- CTR
- Average position
Top Queries
A table showing:
- Search query
- Clicks
- Impressions
- CTR
- Position
Device Performance
Compare:
- Mobile
- Desktop
- Tablet
Country Performance
Identify the countries generating the most search visibility and clicks.
Search Console supports filtering and grouping performance data by dimensions such as pages, queries, countries, devices, search appearance, and dates.
Rolling 28 Days vs Fixed 28 Days
There are two ways people commonly think about a 28-day report.
Fixed Reporting Period
For example:
August 1 → August 28
You create the report once and use those exact dates.
This can be useful for monthly-style reporting.
Rolling 28-Day Window
A rolling window constantly moves forward.
For example:
September 1 → September 28
then:
September 2 → September 29
then:
September 3 → September 30
Every new day enters the window while the oldest day leaves it.
This is useful for monitoring recent performance without waiting for the end of a calendar month.
Why Rolling Windows Can Be Useful
Imagine your website normally receives around 1,000 clicks every 28 days.
Then you publish a successful article and receive a significant amount of additional traffic.
A rolling report lets you observe how that performance affects the recent four-week period.
But you should avoid reacting to a single day’s change.
Instead, watch the trend.
For example:
Week 1 → 1,010 clicks
Week 2 → 1,080 clicks
Week 3 → 1,240 clicks
Week 4 → 1,430 clicks
The trend tells a much stronger story than a single day’s traffic spike.
Why Four Weeks Can Be Better Than One Week
A seven-day report is useful for monitoring short-term changes.
However, seven days can sometimes be too short.
Suppose your website gets:
Week A → 800 clicks
Week B → 1,050 clicks
That is a 31.25% increase.
But perhaps Week B included a special event, holiday, social media campaign, or unusual news event.
A 28-day view provides more observations and can help determine whether the improvement is sustained.
This doesn’t mean that 28 days is always the best reporting period.
Different questions require different periods.
| Reporting Period | Best For |
|---|---|
| 24 hours | Very recent activity |
| 7 days | Short-term changes |
| 28 days | Recent trend and period comparison |
| 3 months | Medium-term SEO trends |
| 6–12 months | Long-term growth and seasonality |
Google Search Console supports multiple date ranges and different time granularities, including daily, weekly, and monthly views.
28 Days Does Not Mean Google Takes 28 Days to Rank a Page
This misconception deserves its own section.
You may see statements online such as:
“Google takes 28 days to rank a website.”
That is not what the 28-day reporting window means.
A reporting window is simply a period used to organize and analyze data.
Google’s search systems do not operate on a simple rule where every webpage must wait exactly 28 days before ranking.
Therefore:
28-Day Reporting Window
            ≠
28-Day Ranking Rule
If you publish a page today, Google may discover, crawl, index, and rank it on a timeline that depends on many factors.
The reporting period simply determines which performance data you are looking at.
Don’t Confuse Search Reporting With Core Web Vitals
There is another important reason people can become confused about the “28-day” terminology.
Core Web Vitals also use a 28-day concept in their assessment methodology.
But that is not the same thing as a 28-day Google Search traffic report.
These concepts should be kept separate:
| Concept | Meaning |
|---|---|
| Search performance reporting | Measures Google Search activity |
| 28-day SEO report | A chosen reporting period |
| Search Console comparison | Compares two data periods |
| Core Web Vitals | Measures real-world page experience/performance data |
Therefore, if an article says that website performance needs a 28-day period, always check which Google system and which metric the article is actually discussing.
Google Search Console Data Is Not Always Final Immediately
Another important consideration when creating reports is data freshness.
The newest Search Console Performance data can sometimes be preliminary and may change as Google continues processing the data. Google specifically notes that preliminary data can appear for the newest periods.
This means a professional report should avoid treating very recent data as permanently final.
For example:
Today's Data
     ↓
Preliminary
     ↓
Google processes additional data
     ↓
Finalized data
When building automated reports, it is therefore useful to distinguish between recent data and completed reporting periods.
Search Console Dates and Time Zones
Another technical detail is worth knowing.
Google documents that Search Console date-based data outside the 24-hour view is shown using Pacific Time (PT). Weekly periods run from Sunday through Saturday, while months are calendar months.
This matters when creating reports for users in other time zones.
For example, if your business operates in India, your internal analytics dashboard may use Indian Standard Time while Search Console’s date reporting follows Google’s documented Search Console date conventions.
If you combine Search Console and Google Analytics data, be careful when comparing individual days.
A small difference in date boundaries can create apparent discrepancies.
How to Calculate 28-Day Growth
A simple growth formula is:
Growth % =
((Current Period - Previous Period) / Previous Period) × 100
Example
Previous 28 days:
1,200 clicks
Current 28 days:
1,500 clicks
Calculation:
((1,500 - 1,200) / 1,200) × 100

= (300 / 1,200) × 100

= 25%
Therefore:
Google Search clicks increased by 25%.
The same approach can be used for impressions, sessions, conversions, revenue, or other metrics—provided the underlying metric is comparable between the two periods.
What If Traffic Goes Down?
A decrease doesn’t automatically mean that SEO performance is getting worse.
For example:
Previous 28 Days
Clicks: 10,000

Current 28 Days
Clicks: 8,500

Change: -15%
Before concluding that the website has an SEO problem, investigate:
1. Which pages lost traffic?
A site-wide decline and a decline concentrated on one page mean very different things.
2. Which queries changed?
Look for queries with significant losses in clicks or impressions.
3. Did impressions also decline?
If impressions dropped significantly, search visibility may have changed.
4. Did CTR change?
If impressions remain stable but clicks fall, CTR may be part of the explanation.
5. Did average position change?
A position decline may explain reduced clicks.
6. Is the change seasonal?
Some topics naturally experience changes in demand.
7. Did a technical change occur?
Check deployments, redirects, indexing issues, robots.txt changes, canonical tags, or other website changes.
Google recommends narrowing a traffic drop to affected pages and dates and then using Search Console’s comparison functionality to investigate differences between periods.
A Better Way to Read the Four Main SEO Metrics
Instead of looking at metrics individually, consider them together.
Scenario 1
Impressions ↑
Clicks ↑
Position ↑
CTR ↔
Potential interpretation:
Your website is becoming more visible and generating more traffic.
Scenario 2
Impressions ↑
Clicks ↓
CTR ↓
Position ↔
Potential interpretation:
Your pages may be appearing more often, but users are not clicking at the same rate.
This could lead you to investigate titles, snippets, search intent, SERP competition, and query relevance.
Scenario 3
Impressions ↓
Clicks ↓
Position ↓
Potential interpretation:
There may be a broader visibility or ranking issue worth investigating.
Scenario 4
Impressions ↑
Position ↑
Clicks ↑
CTR ↑
Potential interpretation:
This is generally a strong combination of signals for organic search performance.
The key lesson is:
Never evaluate an SEO metric in isolation.
Building a 28-Day Report for Your Own Website
If you want to build a recurring website report, a simple workflow could look like this:
Google Search Console
        ↓
Select Search Performance
        ↓
Select 28-Day Period
        ↓
Compare Previous Period
        ↓
Collect Metrics
        ↓
Analyze Pages & Queries
        ↓
Create Dashboard
        ↓
Write Insights
        ↓
Track Changes
You can then repeat the same process every week.
This creates a consistent reporting framework.
Example 28-Day SEO Report Structure
A professional website report could have the following sections.
Page 1 — Executive Summary
Display:
- Total clicks
- Total impressions
- CTR
- Average position
- Growth percentages
- Main observations
Page 2 — Search Performance
Display:
- Daily clicks
- Daily impressions
- CTR trend
- Average position
Page 3 — Top Pages
Display:
- Top pages by clicks
- Top pages by impressions
- Best CTR pages
- Pages gaining traffic
- Pages losing traffic
Page 4 — Search Queries
Display:
- Top queries
- New queries
- Growing queries
- Declining queries
Page 5 — Device Performance
Compare:
- Mobile
- Desktop
- Tablet
Page 6 — Geographic Performance
Analyze:
- Countries
- Regions
- Clicks
- Impressions
Page 7 — SEO Insights
Summarize:
- What improved?
- What declined?
- What changed?
- Which pages need attention?
- What should be done next?
This transforms raw Search Console data into an actual decision-making report.
28-Day Reporting Is About Trends, Not Just Numbers
The biggest advantage of a 28-day window isn’t the number 28 itself.
The real value comes from consistency.
If you use the same reporting methodology repeatedly, you can establish a baseline.
For example:
Report 1
28-day growth: +5%

Report 2
28-day growth: +8%

Report 3
28-day growth: +13%

Report 4
28-day growth: +19%
Now you can see a pattern.
Instead of asking:
“Did my website get more traffic today?”
you can ask:
“Is my website’s organic search performance improving consistently?”
That is a much better SEO question.
When Should You Use a 28-Day Window?
A 28-day window is particularly useful for:
- SEO reporting
- Content performance monitoring
- Website growth tracking
- Comparing current performance with the previous period
- Client SEO reports
- Marketing dashboards
- Monthly-style performance reviews
- Identifying sustained traffic trends
- Monitoring newly published content
- Measuring the effect of SEO improvements
It is less suitable when you need to analyze an immediate event.
For example, if your website suddenly becomes unavailable, you should investigate hourly or daily data rather than waiting for a 28-day report.
Best Practices for 28-Day Website Reporting
Use the Same Period Consistently
Don’t compare arbitrary periods every time.
Choose a repeatable methodology.
For example:
Current 28 days
vs.
Previous 28 days
Compare Multiple Metrics
Don’t report only traffic.
At minimum, consider:
- Clicks
- Impressions
- CTR
- Average position
Investigate Changes
If clicks increase by 30%, don’t stop at:
“Traffic increased 30%.”
Ask:
Which pages generated the increase?
Which queries generated the increase?
Did impressions increase?
Did rankings improve?
Was there an external event?
Don’t Overreact to One Day
Daily fluctuations are normal.
A 28-day window provides a broader view of performance.
Separate Search Console From Total Website Traffic
Search Console measures performance in Google Search.
It should not be interpreted as your complete website traffic report.
For total traffic, you may also need analytics data such as Google Analytics.
Google specifically notes that Search Console traffic analysis is about traffic from Google Search, rather than total user traffic from all sources.
A Note About Google Search Console Achievements
Google has also introduced an Achievements report in Search Console.
For example, Google states that a site can receive an achievement when it reaches certain click milestones from Google Search over a 28-day period. Google also explicitly says that the Achievements report is intended to track progress and does not reflect how Google’s ranking systems work.
This is another good example of why the 28-day period should be understood as a measurement window, not a ranking algorithm.
28 Days: A Simple Mental Model
You can think of the reporting model like this:
                 WEBSITE
                    │
                    ▼
             Google Search
                    │
                    ▼
        ┌─────────────────────┐
        │    28-Day Window    │
        └─────────────────────┘
                    │
          ┌─────────┼─────────┐
          ▼         ▼         ▼
       Clicks  Impressions   CTR
          │         │         │
          └─────────┼─────────┘
                    ▼
             Avg. Position
                    │
                    ▼
           Previous 28 Days
                    │
                    ▼
              COMPARISON
                    │
                    ▼
              SEO INSIGHTS
                    │
                    ▼
              NEXT ACTIONS
The goal is not simply to collect numbers.
The goal is to turn those numbers into useful decisions.
Final Thoughts
A 28-day window is a practical way to evaluate recent website performance because it represents four complete weeks and provides enough data to reduce the impact of normal daily fluctuations.
Google Search Console gives website owners the ability to choose date ranges, compare periods, filter performance data, and analyze metrics such as clicks, impressions, CTR, and average position.
But the most important thing to remember is that 28 days is a reporting choice, not a Google ranking rule.
A good SEO report should use the 28-day window as one part of a larger measurement strategy:
Measure
   ↓
Compare
   ↓
Investigate
   ↓
Understand
   ↓
Improve
   ↓
Measure Again
When this process is repeated consistently, a website owner can move beyond simply asking how much traffic a website received and start understanding why its search performance changed and what should be done next.
Frequently Asked Questions
Is Google Search Console based on a 28-day reporting cycle?
No. The Performance report supports different date ranges, and Google currently documents the default view as the previous three months. A 28-day period is one useful reporting window that can be selected for analysis and comparison.
Does Google take 28 days to rank a website?
No. A 28-day reporting period should not be interpreted as a fixed Google ranking timeline.
Why use 28 days instead of 30 days?
Twenty-eight days represents exactly four weeks. This can make period comparisons easier because each period contains the same number of weekdays and weekends.
Can I compare the current 28 days with the previous 28 days?
Yes. Search Console’s Performance report provides comparison functionality for date ranges and other dimensions.
What are the most important metrics to monitor?
For Google Search performance, four useful starting metrics are:
- Clicks
- Impressions
- CTR
- Average position
Is Search Console traffic the same as total website traffic?
No. Search Console focuses on performance from Google Search. Other traffic sources require other analytics tools.
Is the latest Search Console data always final?
Not necessarily. Google states that the newest Performance data can sometimes be preliminary and may change as processing continues.
Does a 28-day report guarantee that SEO is improving?
No. A 28-day comparison is an analytical tool. SEO performance should be evaluated using multiple metrics, pages, queries, time periods, and business objectives.
Sources and Further Reading
- Google Search Console — Performance Report
- Google Search Console — Advanced Filtering and Comparison
- Google Search Console — Performance Data
- Google Search Console — Traffic Drops
- Google Search Console — Achievements